


Tooth loss (partial or complete) remains a significant public health concern, especially in older adults. Clinically, edentulism (complete loss of natural teeth) greatly affects nutrition, speech, and quality of life. Replacement options include dentures, fixed bridges, and increasingly popular dental implants.
This guide reviews a recent study of the US, tooth loss statistics in North Dakota vs Minot, comparing rates of tooth loss and replacement adoption in Minot and Ward County while examining age, income, and rural versus urban trends that influence care access.
National Tooth Loss Trends
- Prevalence by age: Tooth loss rises sharply with age. Recent U.S. data show only ~1–2% of young adults (ages 20–34) are edentulous, but rates climb to about 5.9% for ages 50–64 and 11–12% for ages 65–74. By age 75+, roughly 20% of Americans have lost all natural teeth. In other words, about 1 in 5 seniors 75+ is completely edentulous.
In contrast, partial tooth loss is much more common in middle age: for example, 6% edentulous at age 50–64 implies many more have some missing teeth. Mean remaining teeth also decline with age (CDC found about 27 teeth on average at 20–34 vs. ~19–20 teeth by 75+). - Income and education disparities: Tooth loss is strongly linked to socioeconomic status. Among U.S. adults, those in high-poverty groups or with only a high-school education show markedly higher edentulism. For 20–64 year olds, edentulism is only 0.9% in households ≥200% of poverty level, but rises to 6.8% among those <100% of poverty.
Likewise, fewer than 1% of adults with >high-school education are edentulous, versus 4.2% of those without a high-school diploma. In seniors (65+), similar gaps appear: CDC data show edentulism ~30% among those in poverty and ~33% among <HS-educated, versus much lower rates in the well-off. These disparities reflect differences in lifelong dental care access and risk factors. - Rural vs. urban: National surveys indicate rural Americans report worse oral health outcomes. For example, a 2023 CareQuest survey found 34% of rural adults rate their oral health as fair/poor, compared to 27% urban and 24% suburban.
Rural residents also skip dental visits more often (40% hadn’t visited a dentist in over a year vs 35% urban). Though these are self-reported measures rather than clinical counts, they align with known higher tooth decay and loss in rural populations.
However, note that among North Dakotan seniors in nursing homes, edentulism was similar in rural (31.1%) and urban (32.4%) settings, suggesting access issues rather than place alone. - Other demographics: Racial/ethnic disparities exist nationally (e.g. higher edentulism in non-Hispanic Blacks). Men tend to have slightly higher tooth loss rates than women.
Smoking also correlates strongly: current smokers have much higher edentulism than never-smokers. (CDC reports 7.6% edentulous in current smokers vs 0.3% in never-smokers among 20–64.) These patterns hold nationwide and imply that areas or groups with more smokers or less education will see higher tooth loss.
Have questions about implants or tooth loss treatment. Contact our office today to speak with our team and get personalized guidance for your next step.
North Dakota Tooth Loss Trends
- Higher historical rates: North Dakota has long had higher tooth loss than the U.S. average. For example, a 2016 ND screening of nursing home residents (age 65+) found 31.8% were edentulous (compared to ~15–20% U.S. seniors). State BRFSS and survey data show ND seniors losing 6+ teeth was about 49% in 2004 – far above the U.S. at that time – and complete edentulism ~25% in 2004.
- Recent improvements: However, ND has seen major improvements. State health reports show that by 2020–2022, the percentage of ND adults 65+ who lost all natural teeth had fallen to roughly 12–13%, very near the national level (~10%).
Similarly, ND seniors missing 6 or more teeth declined from ~49% in 2004 to around 18–30% by 2020 (data vary by survey year). This suggests ND’s gap with the U.S. is closing: younger ND cohorts and better prevention have greatly reduced tooth loss. - Gender and setting: ND data show men often have somewhat higher loss. In the 2016 nursing-home survey, 34.6% of males were edentulous versus 31.0% of females. Remarkably, ND found little rural–urban difference in edentulism among seniors in facilities (31.1% rural vs 32.4% urban). This may reflect that access and other socioeconomic differences are similar across ND. (However, ND’s mostly rural population and workforce shortages likely mean less preventive care in many areas)
- ND vs. U.S. summary: Overall, ND adults (especially seniors) historically lost more teeth than U.S. averages, but have improved sharply. In 2020, ND’s complete edentulism (age 65+) was roughly 13% (comparable to ~10% US). Partially, this improvement reflects national trends; ND also invested in fluoridation and prevention.
Still, ND rates of extensive tooth loss (e.g. missing 6+ teeth) remain modestly higher than national (around 30% vs 18% in 2020). In short, ND mirrors national age-trends but on a steeper curve that has flattened.
Minot/Ward County Tooth Loss Data
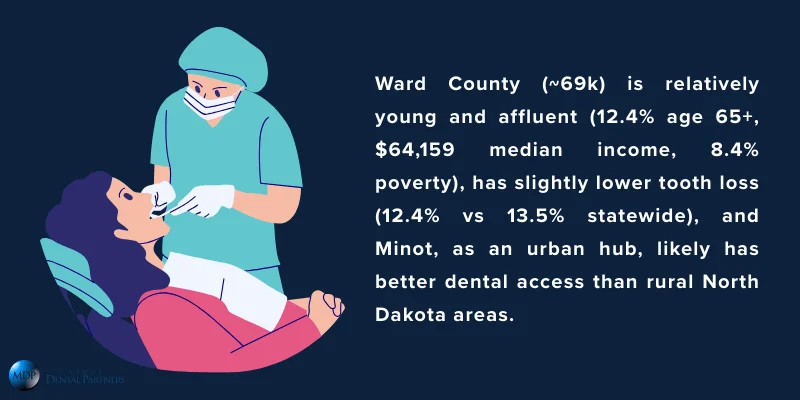
- Local demographics: Minot is the principal city of Ward County, ND. Demographically, Ward County (2017 est. pop ~69k) has a younger and slightly more affluent population than ND as a whole. Only 12.4% of Ward County residents are age 65+ (vs 15% statewide).
The median household income in Ward is $64,159 (vs $61,285 ND), and only 8.4% of residents live below poverty (vs 11.0% ND). Ward’s elderly poverty rate is 5.8% (vs 8.0% ND). Racially, Ward is about 88% White, 2.4% American Indian (ND: 87.7% and 5.3% AI). - Tooth loss in Ward: Direct clinical data for Minot/Ward on tooth loss are limited. The Ward County 2019 Community Health Profile (from ND Department of Health) provides a proxy: 12.4% of adult respondents reported they had ever had a permanent tooth extracted, versus 13.5% for all North Dakota. (This “ever extracted” measure underestimates total loss but suggests Ward’s tooth loss is on par or slightly lower than statewide.)
No local survey reports current edentulism rates, but given the younger, wealthier population, one would expect slightly better oral health than in the rest of ND. For example, fewer seniors in Minot (12.4% of population vs 15% statewide) means fewer people reach the high-loss ages. - Rural vs. urban (Minot context): Minot itself is an urban hub (roughly 47k people) in an otherwise rural region. Overall, Ward County is about half rural.
The local stats above (tooth extraction, income) suggest Minot/Ward likely has lower tooth loss and higher dental utilization than very rural parts of ND. (However, no city-specific published data were found. We infer Minot trends from Ward data.)
If you live in Minot or Ward County, schedule a visit with Minot Dental Partners to discuss your tooth replacement options and create a plan that fits your health and goals.
Tooth Replacement Adoption Trends
Dental implants: Implant use in the U.S. has grown dramatically. Analysis of national surveys shows the percentage of adults with at least one dental implant rose from 0.7% in 1999–2000 to 5.7% in 2015–16.
A focused study of adults 50+ found implants increased from 1.3% (1999–2004) to 8.4% (2015–2020), meaning roughly 8% of older Americans had implants by 2020. The biggest rise was in seniors (age 65–74 saw a 12.9% absolute increase).
Projections suggest implant prevalence will continue climbing; by 2026, some models predict up to 20–23% of eligible patients (those missing teeth) will have implants. Implants are used both for single-tooth replacement and to support dentures/bridges in fully edentulous jaws.
Demographic notes: Implant adoption favors higher socioeconomic groups. Privately insured or better-educated patients have roughly twice the implant rate of the disadvantaged. In one analysis, non-Hispanic Black and low-income seniors were significantly less likely to have implants than white or wealthier peers.
Thus, national implant trends reflect both technological adoption and underlying disparities.
ND & Minot context: There is little published data on implant use specifically in North Dakota or Minot. Anecdotally, implant therapy is growing but limited by workforce. ND’s small population and rural nature mean fewer specialists; a modest number of implants are placed state-wide each year.
We can infer that North Dakota follows the national upward trend, but with lower absolute numbers. In Minot, dental clinics do offer implant services, but most missing-tooth cases are still handled with conventional dentures or bridges.
Overall, implants in ND/Minot are much less common than dentures, simply because cost and access remain barriers, and public insurance often doesn’t cover implants.
Dentures: Removable dentures (full or partial) remain the most common tooth-replacement option for edentulous adults. A 2020 report estimates about 41 million Americans were using dentures that year (roughly 12–13% of the total U.S. population). This high number reflects the large baby-boomer cohort; even as edentulism rates decline, the absolute number of older adults needing dentures remains large.
Denture usage is especially high in seniors: about one in five people 75+ wear complete dentures (since ~20% of that age group are edentulous). Dentures are typically covered by insurance for seniors on Medicaid or Medicare Advantage, so older and poorer adults often end up with dentures rather than implants or bridges.
In ND (and Minot), dentures are similarly widespread among seniors. No recent ND-specific count is available, but historically ND had more elders needing dentures than most states. For example, a 2016 survey found 32% of ND nursing-home residents had full dentures. In practice, any North Dakotan who is edentulous usually receives complete dentures (upper and lower).
Among partially edentulous patients, a removable partial denture (two or more false teeth attached to a base) is still a frequent solution if a fixed bridge or implant is not used. Newer technologies (like digital dentures or implant-retained overdentures) are slowly being adopted by some ND dentists, but traditional acrylic dentures dominate.
Fixed bridges: Dental bridges – fixed prostheses that span gaps between teeth – have long been used for one or a few missing teeth. Reliable national statistics on bridge prevalence are scarce, but bridges remain common.
For example, a dental practice note estimates 36 million Americans have no remaining natural teeth, implying many use complete dentures, but another 142 million are missing at least one tooth (some of whom have bridges or partial dentures).
Bridges tend to be offered to patients who have a few missing teeth and are relatively well-off, since bridges require healthy adjacent teeth. They are especially prevalent among middle-aged adults; younger adults often use implants or partial dentures instead, and older adults with many missing teeth get dentures.
In the U.S., the bridge market is projected to grow moderately (5–6% annually) through the 2020s, reflecting persistent demand even as implants rise.
In North Dakota and Minot, bridges are similarly a staple of dental treatment. Many ND dentists continue placing fixed bridges because they require no surgery. A typical middle-income ND patient missing one tooth might get a bridge anchored by two crowns, rather than an implant, due to cost or lack of specialists.
Data on ND’s bridge use are not available, but the trend is likely static: bridges have not declined significantly, but they are being supplemented by implants for some patients. We found no surveys on ND bridge adoption, but statewide oral health reports still emphasize bridges as an important option for tooth replacement.
Demographic Profiles (Age, Income, Rural/Urban)
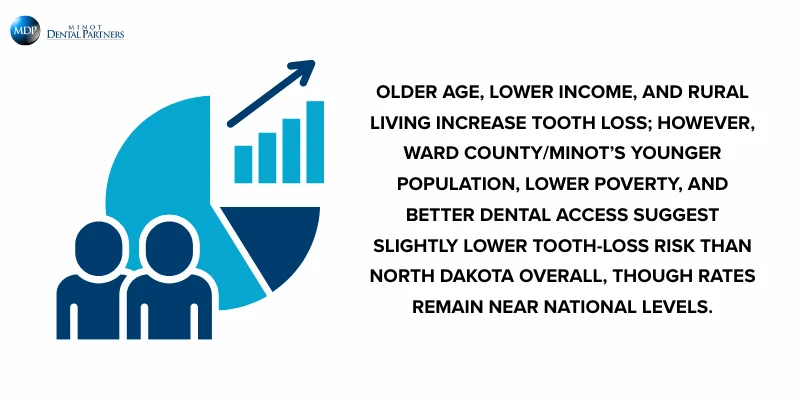
- Age: At all levels, older age strongly correlates with more tooth loss. Nationally and in ND alike, the percentage of people with missing teeth rises steeply after age 50.
Minot/Ward County’s younger age profile (only 12.4% aged 65+ vs 15% ND) suggests a lower community burden of advanced tooth loss. In practice, fewer Minot residents have reached the ages where edentulism is common. - Income and Education: Poorer adults everywhere lose more teeth. North Dakota’s overall poverty rate (11.0%) is only slightly above the U.S. average, and Minot/Ward’s is lower (8.4%). This may partly explain why Ward’s reported adult tooth extraction rate (12.4%) is slightly below the state average (13.5%).
However, ND seniors on public insurance still tend to have more missing teeth than affluent seniors. In clinics, one sees that low-income ND patients more often wear full dentures, while higher-income patients opt for implants or bridges. - Rural vs. Urban: The U.S. picture (rural disadvantage) likely applies within ND. Urban areas like Minot generally have more dentists per capita; for example, Ward County has far more practicing dentists (including specialists) than many ND counties. This means Minot residents likely receive dental care more frequently, which can reduce tooth loss.
Indeed, the Ward report shows a higher annual dental visit rate (36.9%) than the ND average (34.2%). We did not find direct Minot tooth-loss rates, but one can infer: an urban, higher-income community will tend to have slightly less tooth loss than very rural counties.
That said, even in urban North Dakota, overall adult dental visit rates remain only around 65–70%, so tooth loss still occurs in all areas. - Comparisons: Putting it together, North Dakota’s population is older and more rural than the U.S. as a whole, contributing to its historically higher tooth loss. However, ND has somewhat higher median income than many poorer states, and access to fluoridated water is better than some rural states, tempering extremes.
Minot/Ward County stands out within ND as younger and better-off. Thus, one would generally expect: US < ND < Minot in terms of risk factors for tooth loss. (In practice, ND and Minot statistics on tooth loss and denture use are often close to or slightly above national figures.)
Choose trusted local care in Minot ND where our team offers modern implant solutions designed to restore comfort function and long term confidence.
Key Findings & Trends
- Tooth loss is declining but still affects many seniors. Both nationally and in ND, complete tooth loss among older adults has fallen in recent decades, reflecting better prevention. Today, about 11–12% of U.S. adults 65–74 and ~13% of ND adults 65+ are edentulous, vs over 20% two decades ago.
However, nearly 20% of U.S. adults 75+ still have no natural teeth, and comparable data for ND seniors is slightly higher. Partially edentulous rates (missing several teeth) have also declined in ND (ND 65+ missing ≥6 teeth fell from ~49% in 2004 to ~18% by 2020), now roughly on par with the U.S. - Dental implants are surging. Implant therapy is the fastest-growing tooth-replacement method. A nationally representative study found that the proportion of adults with implants jumped over 8-fold from 1999 to 2020 (from ~1.3% to 8.4% in ages 50+).
Supply-side data predict continued growth: market analyses estimate 6–7% annual growth in implant procedures. ND clinics have noted this shift, with more local dentists placing implants or referring out. Still, the absolute number of implant cases in Minot is modest, given the smaller patient pool and higher costs; most complex cases still seek care in larger cities. - Dentures remain widespread. Even as implants grow, removable dentures remain very common. Tens of millions of Americans use them (an estimated 40.99 million in 2020), mostly older adults. In the U.S., roughly one in five people age 75+ wears complete dentures.
In North Dakota, many seniors rely on dentures too – a 2016 ND survey found over 30% of nursing home residents had full dentures. Denture use is a stable trend: the aging of the population means the total number of denture-wearers is holding steady or growing slightly despite each generation having better retention of natural teeth. - Bridges still have a role. Fixed dental bridges (non-removable) continue to be a standard option for patients with one or a few missing teeth. They are less quantifiable in statistics, but many dental schools and clinics note that bridges remain widely taught and used, especially for Medicaid-eligible or younger adults.
In North Dakota and Minot, bridges are routinely offered (often at lower cost than implants). There is some evidence that U.S. dentists are offering fewer new bridges than a decade ago, as implants compete, but bridges have not disappeared.
The key trend is simply that more patients who historically would have gotten a bridge can now choose an implant (or implant-retained denture), but the decision often comes down to patient preference, cost, and medical factors.
References
- Centers for Disease Control and Prevention (CDC). About Tooth Loss. Updated May 15, 2024. (Provides national edentulism rates by age and demographic factors.)
- CDC. 2024 Oral Health Surveillance Report (Table 16: edentulism among adults 20–64, by age and sociodemographic factors). October 2024. (Contains NHANES-based prevalence of edentulism by age, poverty, education, etc.)
- North Dakota Department of Health and Human Services. Adult Oral Health (State data, 2024). (State report with charts showing trends in tooth loss for ND adults 65+ vs U.S.)
- North Dakota Department of Health. Ward County Community Health Profile, 2019. (Public report with BRFSS data for Ward County/Minot including tooth extraction and demographics.)
- Elani, H.W., Starr, J.R., da Silva, J.D., & Gallucci, G.O. (2018). Trends in dental implant use in the U.S., 1999–2016, and projections to 2026. Journal of Dental Research, 97(13):1424–1430. (NHANES analysis showing implant prevalence rising from 0.7% to 5.7% in 1999–2016, with projections up to 2026.)
- Weatherspoon, D.J., Chen, H., & Dye, B.A. (2024). Implant and implant restoration trends among adults 50 years and older in the United States, NHANES 1999–2020. Journal of the American Dental Association, 155(7):574–586.e3. (Finds dental implant prevalence jumped from 1.3% to 8.4% among U.S. adults 50+ between 1999 and 2020.)
- Kolen, D. (2022). “The Latest in Dentures.” Academy of General Dentistry News (Sep 12, 2022). (Dental news article noting ~40.99 million Americans reported using dentures in 2020.)
- CareQuest Institute for Oral Health. (2024). “Rural Populations Have Worse Oral Health Care Access, Utilization, and Outcomes…” Press Release (Jan 17, 2024). (Reports that 34% of rural adults rate their oral health fair/poor vs 27% of urban, and 40% rural residents haven’t seen a dentist in >1 year.)


